Screenshots
Here are some screenshots that may help you to roughly see how JVM Monitor looks like.
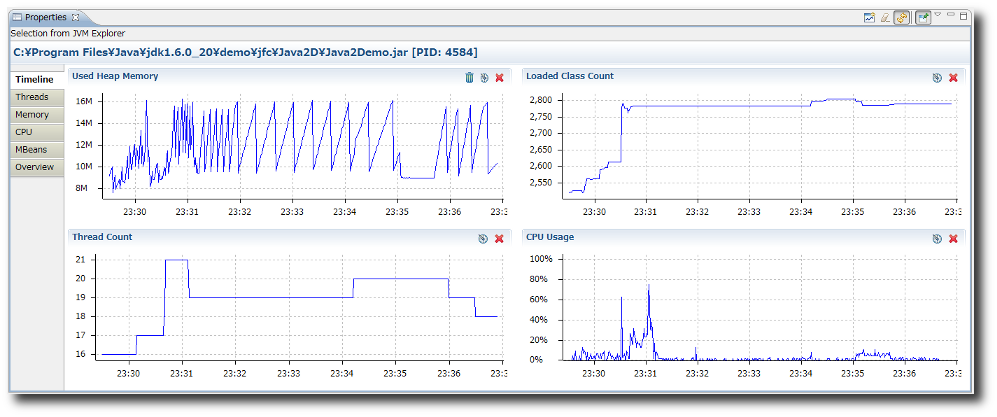
Monitoring attributes on charts
Used heap memory, loaded class count, thread count and CPU usage are monitored on charts by default. The charts are configurable to monitor other attributes defined in MBeans.
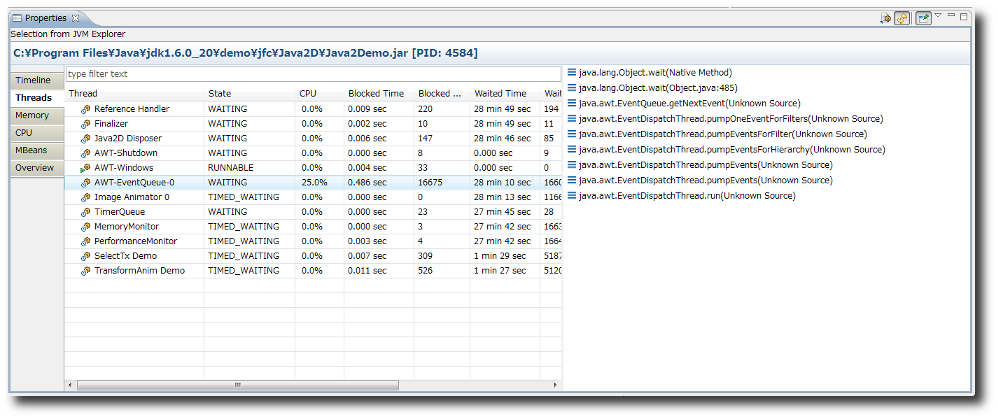
Monitoring threads
The currently running threads and their stack traces are monitored. Deadlocks are automatically detected, and you can check the lock objects and lock owners.
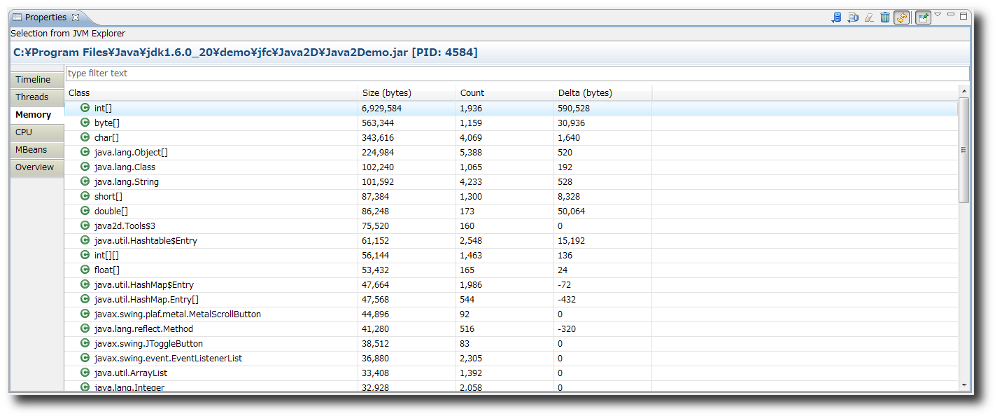
Monitoring heap histogram
Heap histogram (that is the object size and count for each class) is monitored. In addition, you can monitor the delta object size from the time you clear delta.
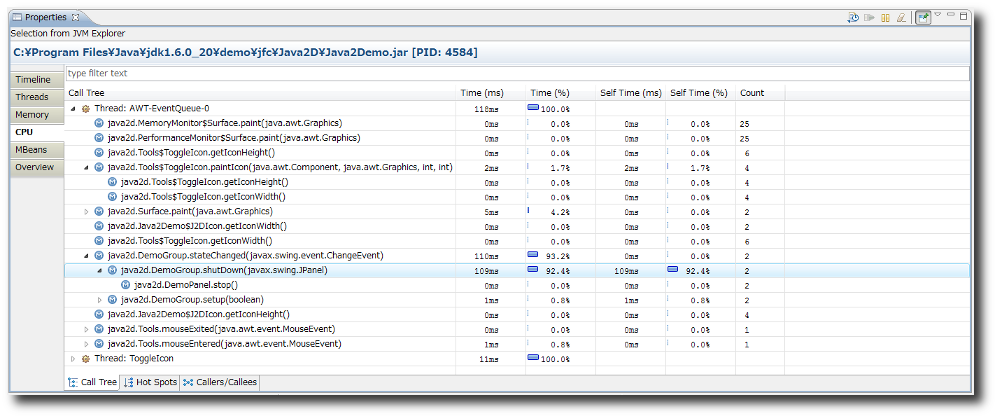
Monitoring CPU usage
CPU usage is monitored with call tree, hotspots list and callers/callees list.
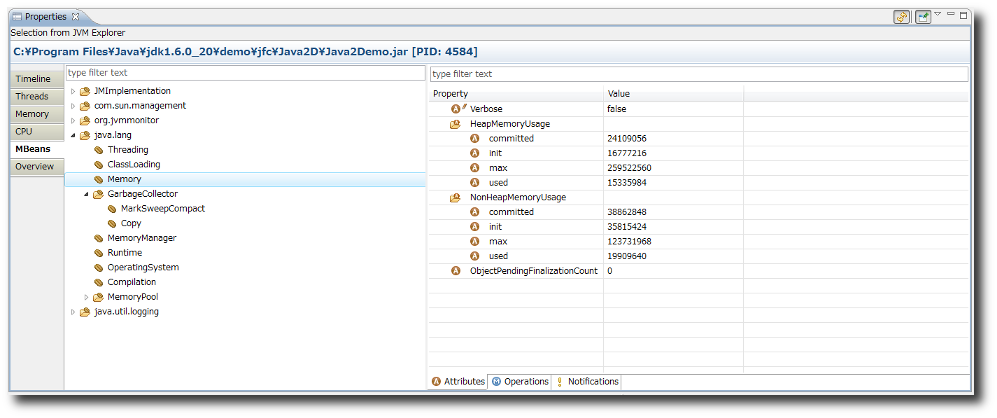
Monitoring MBeans
MBean attributes are monitored. In addition, you can execute MBean operations and also subscribe MBean notifications.