Table of Contents
- 1. Getting Started
- 1.1. Viewing JVMs
- 1.2. Starting monitoring JVM
- 1.3. Stopping monitoring JVM
- 2. Tasks
- 2.1. Monitoring attributes in timeline
- 2.1.1. Adding other attributes on existing chart
- 2.1.2. Creating a new chart
- 2.2. Monitoring threads
- 2.2.1. Identifying the code causing deadlock
- 2.2.2. Identifying the code consuming CPU resource
- 2.3. Monitoring memory usage
- 2.3.1. Identifying the objects consuming heap memory
- 2.3.2. Analyzing object references
- 2.3.3. Identifying SWT resource leak
- 2.4. Monitoring CPU usage
- 2.4.1. Configuring CPU profiler
- 2.4.2. Running CPU profiler
- 2.4.3. Analyzing call tree
- 2.4.4. Analyzing hot spots
- 2.4.5. Analyzing callers/callees
- 2.5. Monitoring MBeans attributes
- 2.5.1. Viewing and editing MBean attributes
- 2.5.2. Invoking MBean operations
- 2.5.3. Subscribing MBean notifications
- 2.6. Monitoring JVM on remote host
- 3. FAQ
1. Getting Started
1.1. Viewing JVMs
To view the currently running JVMs on local host:
-
Open Java Monitor perspective [
 ]
selecting Window > Open Perspective > Other... > Java Monitor.
]
selecting Window > Open Perspective > Other... > Java Monitor.
-
Find JVM Explorer that appears at the top left on Eclipse window.
JVM Explorer shows the currently running JVMs on local host.
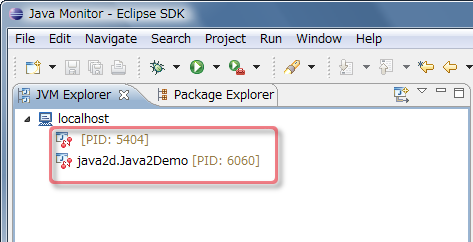
Note: If you cannot find any JVMs on JVM Explorer, see FAQ.
1.2. Starting monitoring JVM
To start monitoring JVM:
-
Select JVM on JVM Explorer, and select the context menu Start Monitoring.
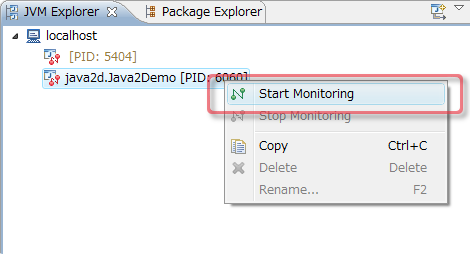
- Find Properties view popped up that has several pages showing the threads, memory, CPU usage etc.
Note: Alternatively you can start monitoring JVM by double-clicking JVM on JVM Explorer.
1.3. Stopping monitoring JVM
To stop monitoring JVM, select the JVM on JVM Explorer, and select the context menu Stop Monitoring.
2. Tasks
2.1. Monitoring attributes in timeline
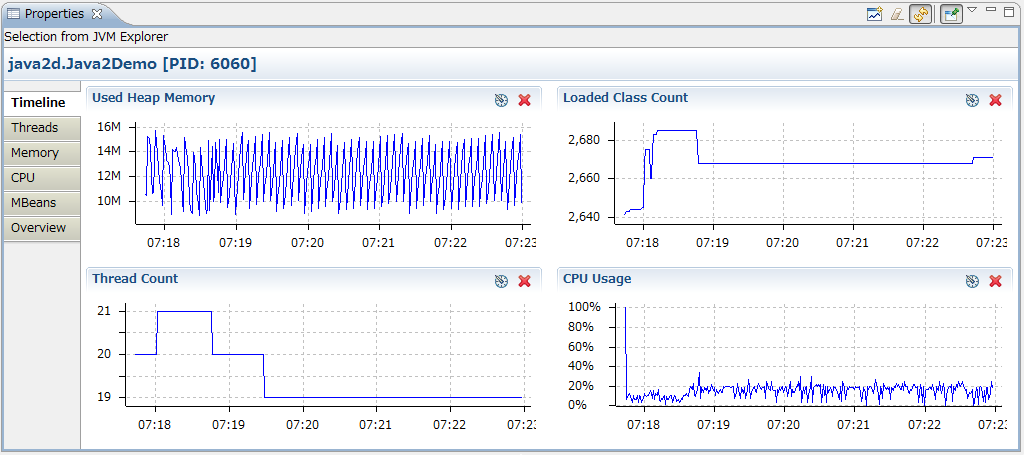
When you start monitoring a JVM and open Timeline page on Properties view, you can see the trend of the used heap memory, the loaded class count, the thread count and the CPU usage on charts by default.
2.1.1. Adding other attributes on existing chart
Those default charts could be sufficient to have rough insights whether any unexpected things happen in JVM. However, in some cases, you may want to monitor some additional attributes.
To monitor additional attributes on existing chart:
-
Open Configure Chart dialog by pressing Configure Chart button
[
 ] at the top right on chart.
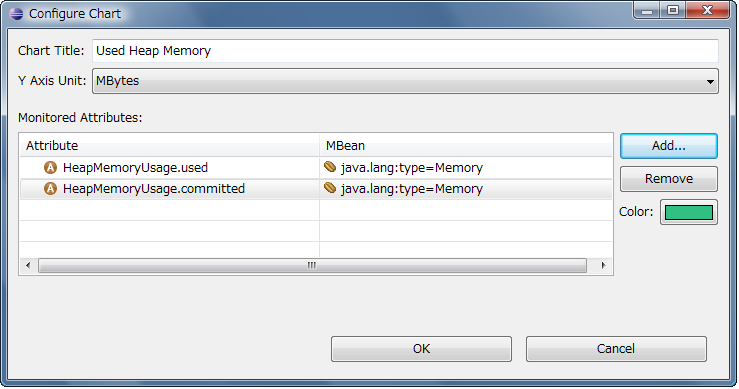
This dialog enables you to configure the chat title, the Y axis unit and the color for each attribute. You can also remove attributes from chart by pressing Remove button.
-
Open Attribute Selection dialog by pressing Add... button on Configure Chart dialog.
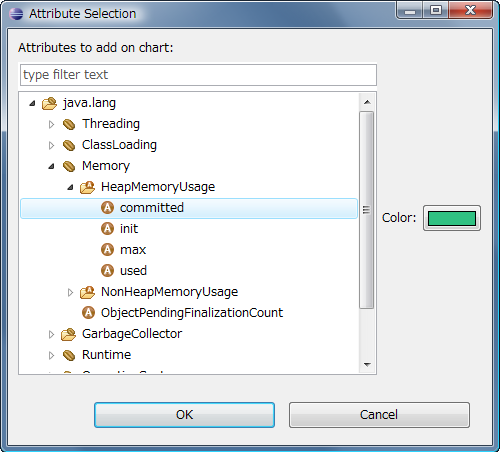
- Select the attributes that you want to monitor, and press OK button. The color is automatically assigned to each attribute, but you can choose your favorite color as needed.
- Press OK button on Configure Chart dialog to apply changes.
2.1.2. Creating a new chart
When it doesn't fit for the existing charts to have additional attributes, you may want to create a new chart.
To monitor additional attributes on a new chart:
-
Open New Chart dialog by pressing New Chart button
[
 ] at local tool bar on Properties view.
- Add attributes in the same way as Configure Chart dialog described above.
Note: You can add a new chart also with Show in Timeline dialog that is available at MBeans page and Overview page.
Note: You can save the current set of charts with the local menu Save Chart Set As....
2.2. Monitoring threads
When you start monitoring a JVM and open Threads page on Properties view, you can see the list of threads and stack traces.
2.2.1. Identifying the code causing deadlock
When monitoring a JVM, deadlock is automatically detected and you can find out which threads are involved in deadlock.
To identify the code causing deadlock:
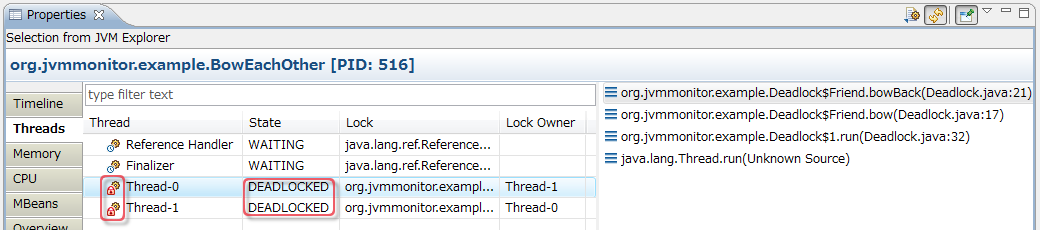
- Search the threads that has the state DEADLOCKED at State column. If there are many threads, you may click the header of State column to sort threads, or type the filter text "DEADLOCKED" at filter.
- Look at Lock column and Lock Owner column to find out the lock object and its owner thread for each locked thread.
- Select the deadlocked thread so that its stack traces are shown on right hand side, and find out which methods are being invoked.
- Double-click the method in stack traces to check the code on Java editor.
2.2.2. Identifying the code consuming CPU resource
When you notice that CPU is unexpectedly overloaded (e.g. when monitoring CPU usage at Timeline page), you may want to identify which part of code is actually consuming CPU resource.
To identify the code consuming CPU resource:
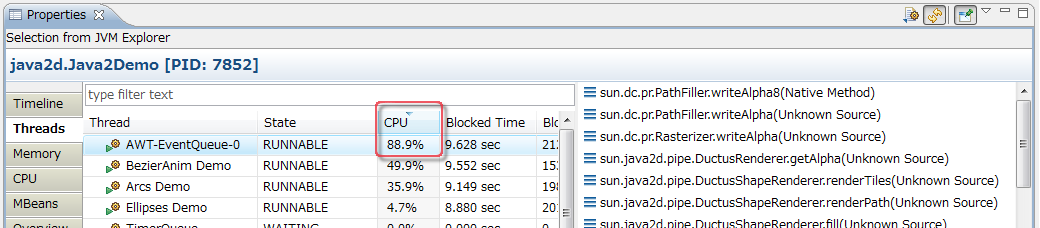
- Click the header of CPU column at threads table to sort.
- Select the thread that has high load of CPU so that its stack traces are shown on right hand side, and find out which methods are being invoked.
- Double-click the method in stack traces to check the code on Java editor.
Note: If the refresh is too fast to see the content, unselect Refresh toggle button
[ ] at the local toolbar to disable refresh.
Alternatively, you can change the period to update on preference page
Window > Preferences > Java > Monitor > Period to update.
] at the local toolbar to disable refresh.
Alternatively, you can change the period to update on preference page
Window > Preferences > Java > Monitor > Period to update.
2.3. Monitoring memory usage
When you start monitoring a JVM and open Memory page on Properties view, you can see the heap histogram showing the object size and the object count for each class.
2.3.1. Identifying the objects consuming heap memory
When you notice that the heap memory is unexpectedly consumed (e.g. when monitoring used heap memory at Timeline page), you may want to identify which objects are actually consuming heap memory.
To identify the objects consuming heap memory:
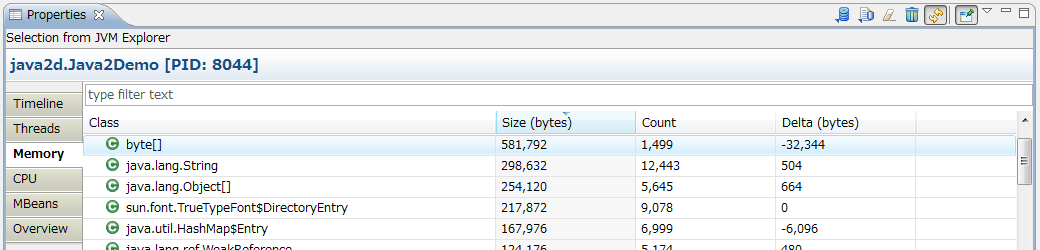
- Make sure that the heap histogram is sorted by Size column, and see the consumed heap memory size for each class.
-
If you are interested in which objects are being increased during a certain duration,
press Clear Delta button
[
 ] at the local toolbar to clear delta size,
and sort with Delta column.
] at the local toolbar to clear delta size,
and sort with Delta column.
- Double-click the class to check the code on Java editor as needed.
Note: If the refresh is too fast to see the content, unselect Refresh toggle button
[] at the local toolbar to disable refresh.
Alternatively, you can change the period to update on preference page
Window > Preferences > Java > Monitor > Period to update.
2.3.2. Analyzing object references
When you find out which objects are actually consuming heap memory, you may want to see which objects are keeping the reference to those objects. JVM Monitor doesn't provide an ability to analyze the references, but instead provide an ability to generate hprof file, so that you can further analyze the references with other tools like Memory Analyzer.
To analyze object references:
-
Press Dump heap as hprof file button
[
 ] at the local toolbar to generate hprof file.
- Analyze object references with hprof file. In case Memory Analyzer plug-ins are installed in your Eclipse, Memory Analyzer is automatically opened after generating hprof file.
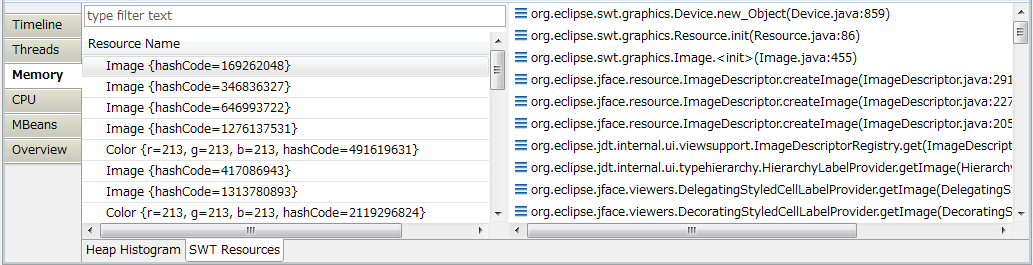
2.3.3. Identifying SWT resource leak
When your Java application is based on SWT, you may want to check if there are any operating system
resource leak that can be caused by missing invocation of org.eclipse.swt.graphics.Resource.dispose().
To identify SWT resource leak:
-
Open SWT Resources page that is available in case of monitoring SWT-based Java application.
On the left hand side, you can see SWT resources that have been allocated after connecting to JVM.
When you select one of SWT resources, you can see its stack trace on the right hand side,
so that you can identify the source code in which the SWT resource was allocated.
-
Press Clear button
[] at the local toolbar to clear the
currently shown resources.
Node: Clear button doesn't dispose SWT resources in JVM, but just makes the currently shown resources invisible.
- Do some operations in which you suspect resource leak. Typically, it would be a set of operations that finally go back to the initial state of operations (e.g. opening a view and closing a view). You will see the resources that are newly allocated but not displosed.
2.4. Monitoring CPU usage
When you start monitoring a JVM and open CPU page on Properties view, you can see the CPU usage.
2.4.1. Configuring CPU profiler
To configure CPU profiler:
-
Open Configure CPU profiler dialog by clicking the link select profiled Java packages on CPU page.
Node: Once you specify Java packages to profile, you can open the dialog with the context menu Configure CPU Profiler....
This dialog enables you to specify Java packages. CPU profiler profiles the methods of classes belonging to the specified Java packages.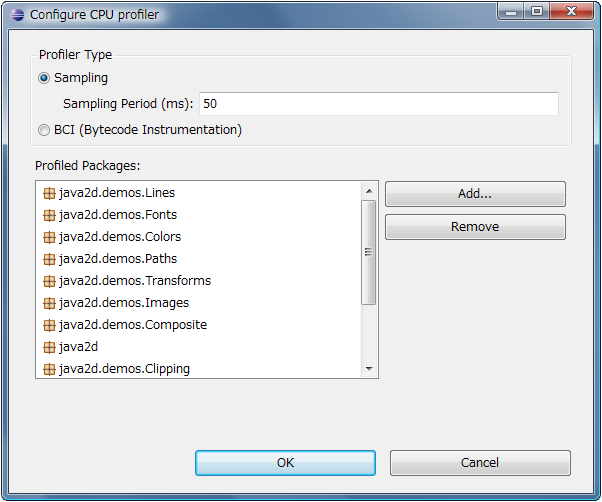
- Open Package Selection dialog by clicking Add... button on Configure CPU Profiler dialog. Select Java packages from the existing Java packages contained in currently opened projects in workspace, and press OK.
- There are two types of CPU profiler: Sampling and BCI (Bytecode Instrumentation). Typically, you may first use the sampling profiler for quick analysis. After you identify the area of code that has a bottleneck of performance, you may narrow down the Java packages to profile, and use BCI profiler to get more precise profiling data. Select profiler type, and press OK.
Note: The configuration will persist in workspace so that you don't have to configure CPU profiler when restarting Eclipse.
Note: The configuration can be dynamically applied to JVM even while running CPU profiler.
2.4.2. Running CPU profiler
To run CPU profiler:
-
Press Resume CPU Profiling button
[
 ] at the local toolbar.
-
To clear profiling data, press Clear CPU Profiling Data button
[] at the local toolbar.
-
To suspend CPU profiler, press Suspend CPU Profiling button
[
 ] at the local toolbar.
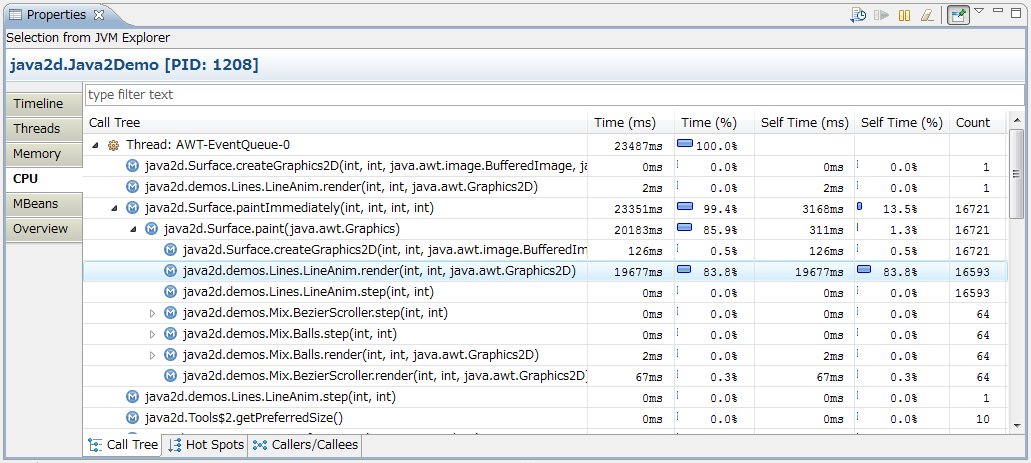
2.4.3. Analyzing call tree
To analyze call tree:
- Make sure that Call Tree page is opened showing a list of threads. The total time of method invocation is shown at Time (ms) column for each thread.
- Expand a thread node to see the methods call tree.
- Search the method node that has relatively large value of self invocation time shown at Self Time (ms) or Self Time (%) column. The self invocation time means the invocation time without taking the invocation time of callees into account. To find such method that is likely bottleneck of perfornamce, you may repeat expanding the method node that has relatively large value of total invocation time shown at Time (ms) column.
- Double-click the method node to check the code on Java editor. To improve the performance, one direction is to reduce the self invocation time per invocation, and the other direction is to reduce the invocation count. The invocation count is shown at Count column.
Note: If you select the method node and select the context menu Focus On '<method name>', the selected method node becomes the root node and Time (%) and Self Time (%) are re-calulated with only the focused method and its callees, so that you can focus on the area of interest.
Note: When selecting multiple method nodes, the sum of self invocation time of selected methods are shown at status line at bottom of Eclipse window.
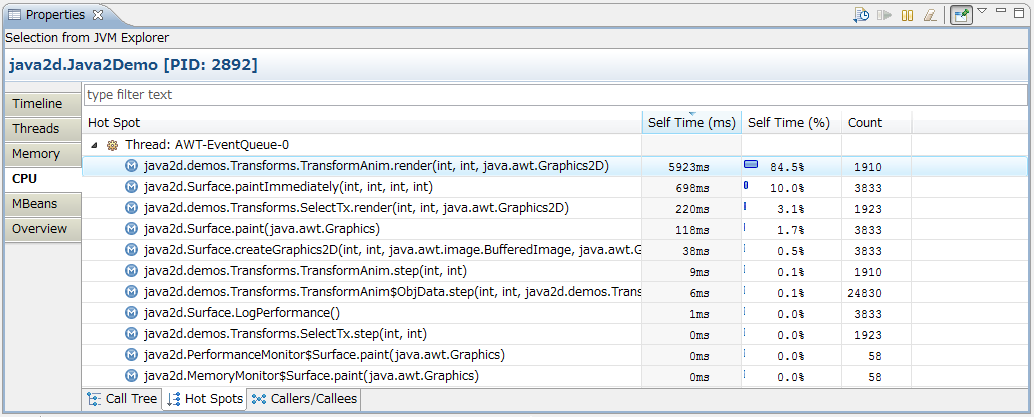
2.4.4. Analyzing hot spots
To analyze hot spots:
- Make sure that Hot Spots page is opened showing a list of threads.
- Expand a thread node to see the hot spots.
- Make sure that the methods are sorted with Selt Time column, and find out which methods have relatively large value of self invocation time.
- Double-click the method to check the code on Java editor.
Note: When selecting the context menu Focus On '<method name>' on Call Tree page, only the focused method and its callees are shown.
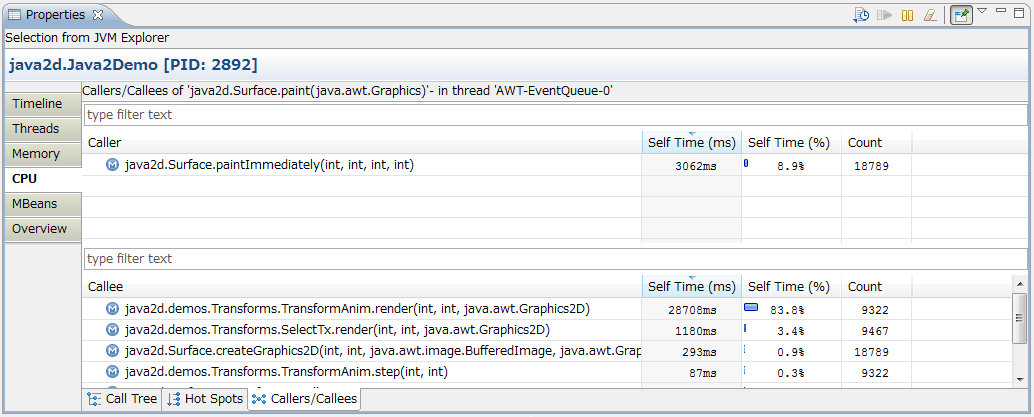
2.4.5. Analyzing callers/callees
You may want to find callers and callees of a certain method in some cases. For example, when you look at Hot Spots page, and find out that a certain method has relatively large value of invocation count, you may want to find its callers. Note that there can be other places that the same method is called in the call tree.
To analyze callers/callees:
- Select a method on Call Tree page or Hot Spots page, and select the context menu Show Callers/Callees to show the callers and callees of the selected method on Callers/Callees page.
- Double-click the method to check the code on Java editor as needed.
Note: You can further show callers and callees by selecting the context menu Show Callers/Callees.
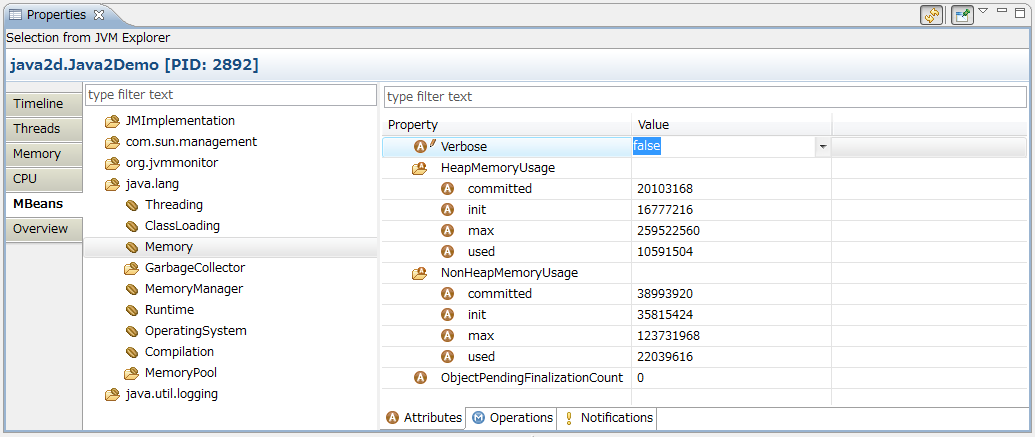
2.5. Monitoring MBeans attributes
When you start monitoring a JVM and open MBeans page on Properties view, you can see MBeans.
2.5.1. Viewing and editing MBean attributes
To view and edit MBean attributes:
- Select an MBean, and make sure that Attributes page is opened to view the associated MBean attributes.
-
The MBean attribute icon with pencil [
 ]
indicates that the attribute is editable.
If you want to edit attribute, slecect the table cell at Value column and edit it with table cell editor.
]
indicates that the attribute is editable.
If you want to edit attribute, slecect the table cell at Value column and edit it with table cell editor.
Note: If you want to monitor an attribute on Timeline page, select the attribute and select the context menu Show in Timeline....
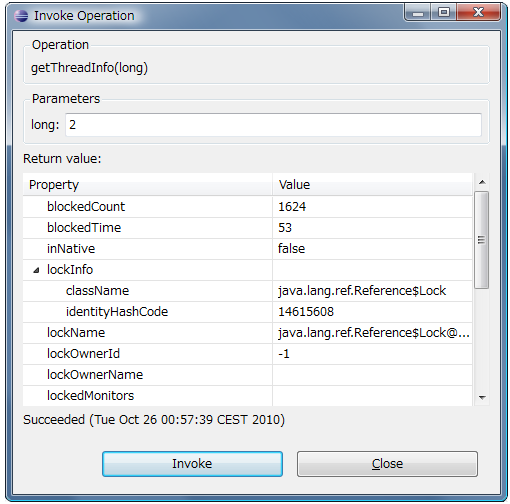
2.5.2. Invoking MBean operations
To invoke MBean operations:
-
Select an MBean, and make sure that Operations page is opened to invoke the associated MBean operation.

-
Select an operation, and select the context menu Invoke... to open Invoke Operation dialog.
Enter the parameters, and press Invoke. The return value is shown at Return value section on dialog.
Press Close to close the dialog.
2.5.3. Subscribing MBean notifications
To subscribe MBean notifications:
-
Select an MBean, and click the link Subscribe on Notifications page.
Alternatively select an MBean and select the context menu Subsctibe Notification.
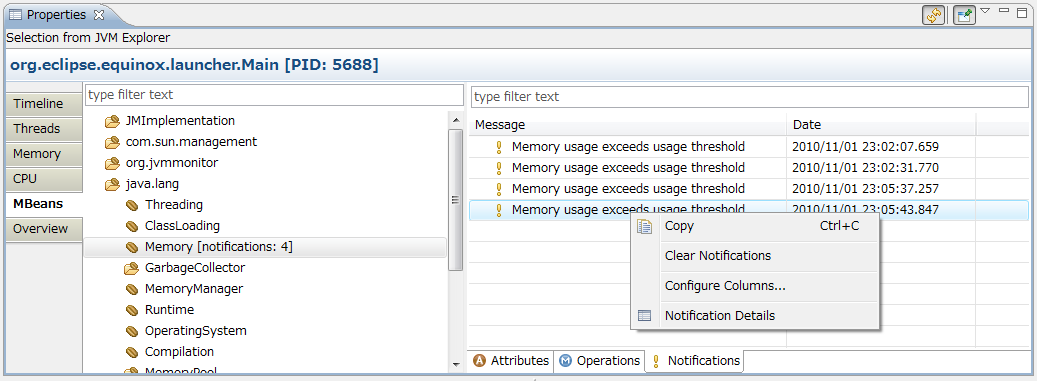
-
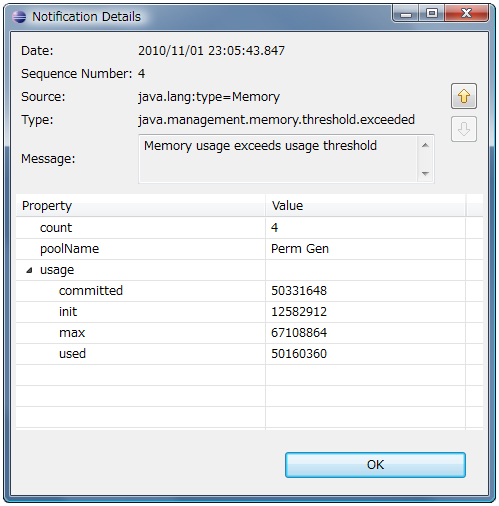
When you get notification, select the context menu Notification Details
to open Notification Details dialog to see details.
2.6. Monitoring JVM on remote host
To monitor JVM on remote host:
-
Start JVM on remote host with system properties for
 JMX remote management.
The following example is the case of connecting with port 9876,
without using SSL and without setting password.
JMX remote management.
The following example is the case of connecting with port 9876,
without using SSL and without setting password.
-Dcom.sun.management.jmxremote.port=9876 -Dcom.sun.management.jmxremote.ssl=false -Dcom.sun.management.jmxremote.authenticate=false -
Press the button Add JVM Connection on Remote Host
[
 ] on JVM Explorer to open New JVM Cpnnection dialog.
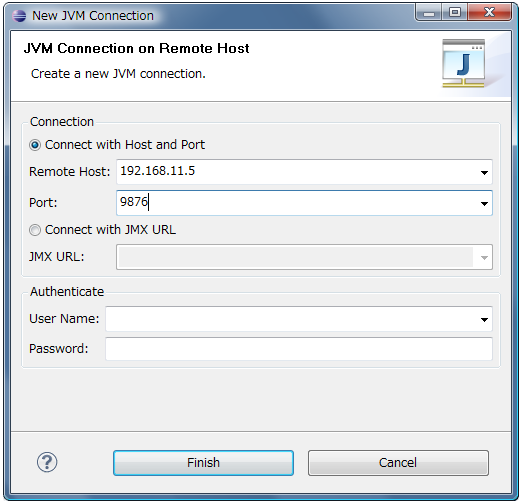
-
Enter the remote hostname (or IP address) and port number.
Note: Alternatively, you can enter
JMX URL. - If you set password when starting JVM, enter also the user name and password.
Note: When monitoring JVM on remote host, there are following constraints.
- Heap histogram are not shown on Memory page, while you can dump heap as hprof file.
- BCI mode of CPU profiler is disabled by default. To enable it, see FAQ.
3. FAQ
Why cannot I find any JVMs on JVM Explorer?
Why do I get the message "Monitoring is not supported for the selected JVM"?
How can I enable the BCI mode of CPU profiler on remote host?
How can I monitor my application that runs only for very short time?
Why cannot I find any JVMs on JVM Explorer?
At least one JVM (Eclipse itself) should be shown on JVM Explorer. If no JVM is shown, there are two possible causes.
cause 1) Eclipse is not started with supported JDK. For example, JRE might be used instead of JDK.
To solve the issue,
- Check the value of system property java.home with Help > About Eclipse > Installation Details > Configuration. You may see that the supported JDK is not specified to java.home.
- Close Eclipse.
-
To enforce using a desired JDK on Eclipse, specify the option -vm to the eclipse executable,
or alternatively specify it in eclipse.ini.
See the
Workbench User Guide to learn how to specify that option.
- Start Eclipse.
Note: If failed to specify -vm option or if you don't want to change the eclipse launch settings, you may try specifying the JDK on preference page Window > Preferences > Java > Monitor > Tools > JDK Root Directory.
cause 2) The folder %TMP%\hsperfdata_* could be not permitted for JVM to create a new file on Windows.
To solve the issue,
- Change the security settings for that folder,
- Or alternatively set TMP environmental variable to writable directory.
Note: After changing settings, not only your application but also Eclipse have to be restarted.
Why do I get the message "Monitoring is not supported for the selected JVM"?
There are several cases that this message is shown.
-
If you see the additional message "Agent JAR loaded but agent failed to initialize",
giving the following JVM option to target JVM may solve the issue.
-Dcom.sun.management.jmxremote - If you see the additional message "Unable to attach to 32-bit process running under WOW64", your application is running with 32bit Java while using 64bit Eclipse on Windows. Either using 64bit Java for your application or using 32bit Eclipse solves the issue.
- If you see the additional message "Unable to attach to 64-bit process", your application is running with 64bit Java while using 32bit Eclipse on Windows. Either using 32bit Java for your application or using 64bit Eclipse solves the issue.
- If you see the additional message "The VM does not support the attach mechanism", your application might be running with unsupported Java version (e.g. Java 1.5). Using Java 1.6 or 1.7 for your application solves the issue.
- If you see the additional message "Unable to open socket file: target process not responding or Hotspot VM not loaded", either your application didn't respond creating a socket file like /tmp/.java_pid1234 (e.g. due to hangup, file system permission), or JVM Monitor was not able to find the created socket file (e.g. due to the bug 7009828).
- If you see the additional message "No providers installed", JDK root directory specified on preference page doesn't match with JDK with which Eclipse is started. See the previous question for the procedure to start Eclipse with supported JDK. After changing JDK root directory on preference page, Eclipse has to be restarted.
- If you see error message "Could not open PerfMemory" on Error Log view on Windows, the directory %TMP%\hsperfdata_* is not permitted to create a new file. See the previous question for the solution.
- If you don't see any additional message, your application might be shut down in the meantime.
How can I enable the BCI mode of CPU profiler on remote host?
To enable BCI mode of CPU profiler on remote host,
-
Find the agent file jvmmonitor-agent.jar at plug-ins instalation directory.
<plug-ins instalation directory>/org.jvmmonitor.core/lib/jvmmonitor-agent.jar - Copy the agent file to arbitrary directory on remote host.
-
Start your application on remote host with the following options.
-javaagent:<path>/jvmmonitor-agent.jar
Note: When you upgrade the version of JVM Monitor, jvmmonitor-agent.jar has to be copied again.
Note: If you use JDK/JRE 6, white space cannot be contained in the path due to the bug 6459832
How can I monitor my application that runs only for very short time?
To monitor the application that runs for so short time that you cannot connect JVM Monitor,
- Set a break point at point of interest, and run your application with debug mode.
- Connect JVM Monitor to the application while stopped at break point.
- Collect profiling data with JVM Monitor.
Note: If your application is started from outside Eclipse, you may specify the following option for your application to suspend until debugger is attached.
-agentlib:jdwp=transport=dt_socket,address=<port number>,server=y,suspend=y